Estimating Google’s Two-Factor (2SV) Adoption with Pen, Paper, and Poor Math
Friday, May 15, 2015
As a two-factor authentication vendor, reporters often ask us about the state of strong authentication. A common question that comes up is: How many people actually use two-factor authentication? What is the largest two-factor deployment?
Well, the largest scale deployments of two-factor are often consumer use cases. Despite having very low adoption rates in terms of % of total users, large service providers like Google, Microsoft, Apple, etc have hundreds of million of users, dwarfing the 2FA deployments of even the largest enterprise use cases.
Unfortunately, these consumer websites are pretty tight-lipped about their deployment and adoption of security technology like two-factor. While it’s common belief that Google has one of the largest deployments with their 2SV (two-step verification) service, there’s not much public information about its scale and scope.
As a fun exercise (and a blatant abuse of all sound statistical methods known to man), I’ve decided to estimate Google’s 2SV adoption rate and deployment size, based only on two unrelated public disclosures of information from Google, a trusty ruler, and good ol’ pen and paper!
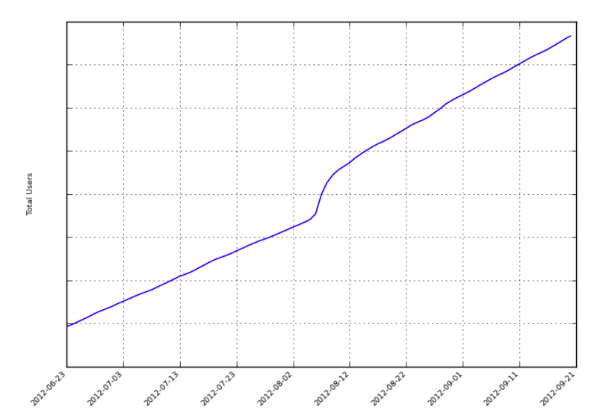
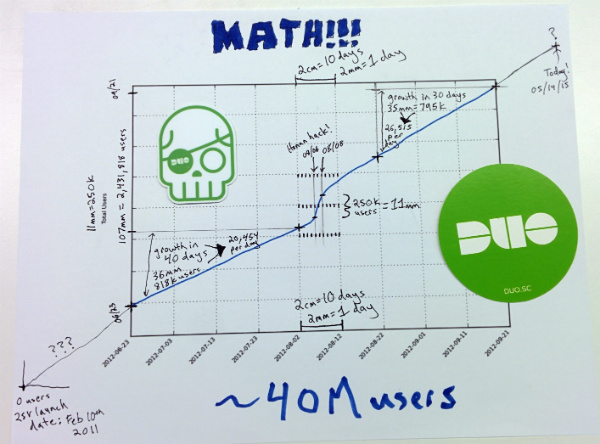
- An unlabeled graph provided by Google to Wired for their article titled “Google Declares War on the Password”:
A snippet of a sentence from Google’s “Authentication at Scale” article written for IEEE S&P:
“Adopted by millions, it’s among the largest two-factor authentication deployments in the world. Nearly a quarter million accounts added 2sv during the two days after Mat Honan’s story broke illustrating a phenomenon that we observe more broadly…”
Ok, so we have a scale-less graph from 2012 and a vague statement about an increase of ~250,000 users in a two day period. Obviously, it’s time for MATH!
Turns out that two-day period of the 250k user increase is right smack in the middle of the scale-less graph. With our very unscientific methods, we can start to put a scale back on that graph!
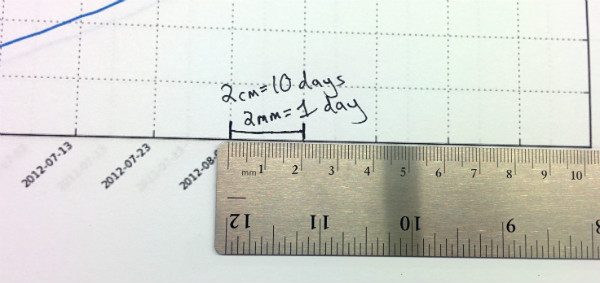
First step, what’s the X-axis? Each graph tick on the X-axis is a 10 day period. Therefore, based on a ruler I happened to find around the office (I’m as surprised as you we have a ruler), each tick is 2cm, meaning 2mm = 1 day on the X-axis:
According to the article, nearly 250k accounts were added during the two days after Mat Honan’s epic hack. Mat’s article first went live on 08/06, so we can map out the exact uptick in the two-day period from 08/06 to 08/08:
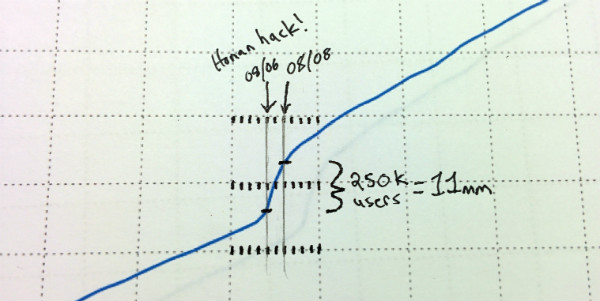
Again using our Ruler of Truth, it tells us that the uptick from 08/06 to 08/08 was a 11mm change on the graph scale. Now we can de-anonymize the scale of the graph’s Y-axis!
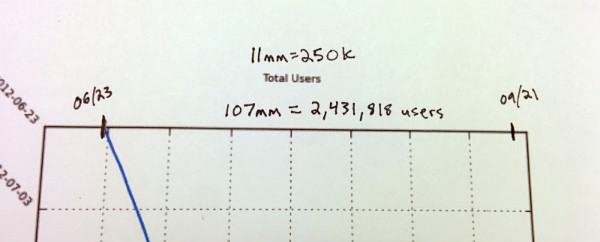
If 11mm represents 250k users, then this particular graph snapshot that starts on 06/23 and ends on 09/21 represents a growth of ~2.4M users (107mm = 2,431,818 users):
But, how do we know absolute numbers? We know relative growth of users within the date bounds of the graph, but to get absolute numbers, we’d need to project backwards or forwards to some known datapoint. Unfortunately, we don’t have any hard data points tied to a particular date. Except…we know the date Google launched 2SV (February 10th, 2011) and we know there were approximately zero users at that launch date. Yeah, terrible approximation, but let’s roll with it!
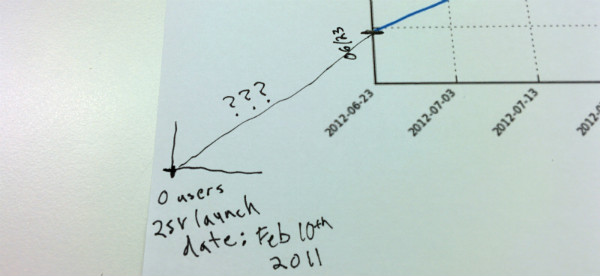
What’s the rate of growth from 2011/02/10 (day of launch) to 2012/06/30 (560 days after launch)? Let’s assume that growth is consistent for this entire period and just calculate the slope of the line for the portion of the graph that we have data for:
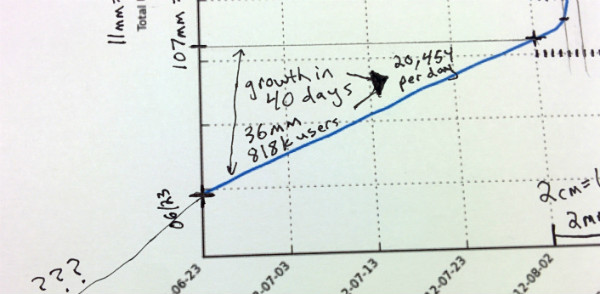
We end up with a growth rate of 20,454 users per day. If 2012/06/30 is 560 days post-launch, then we estimate that there were ~11M (11,454,240) users enrolled at that time. That means in the period shown in the graph, we enter the graph on 2012/06/23 at ~11M and exit the graph on 2012/09/21 at ~14M users (11,454,240 + 2,431,818 = 13,886,058).
Ok, great, but what about adoption in the present day? Let’s take our last (mis)step and project forward from 2012 to the current day in 2015. I mean, it’s only three years, I’m sure we can just accurately project out linearly based on the slope of a one month sample. Right? Ok, good.
The slope exiting the graph looks to be slightly steeper than the pre-Honan era entering the graph, so let’s measure that new growth rate:
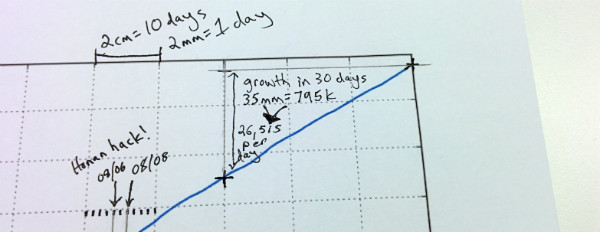
So, we’re exiting the graph at a growth rate of 26,515 users per day. Now to project that daily growth rate out from 2012/09/21 to the current day of 2015/05/14:
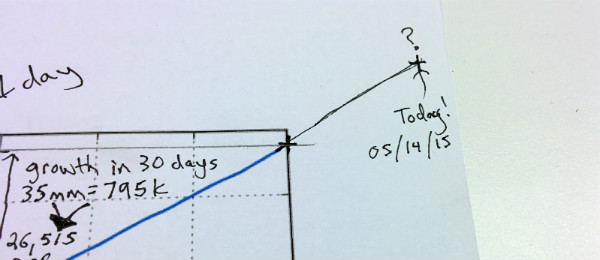
If we project out to the current day (965 days later), that’s a growth of ~25M users (25,586,975). Add that to the ~14M base number of users (13,886,058) exiting the graph and we end up at a grand total of…
Nearly 40 million users (39,473,033) enrolled in Google’s 2SV.
Plus or minus, say, 10M. ;-) And here’s the resulting pen-and-paper marked-up graph after all our “math” shenanigans:
What about total adoption rate as a percentage? Well, how many total Gmail users are out there that might take advantage of Google’s 2SV service? Some estimates back in 2012, put the number of monthly active users at 425 million. More recent estimates in 2014 say 500 million. Ground truth here is very difficult so let’s just throw a dart at the wall and say 600 million users.
So if we assume ~600M users and ~40M enrolled with 2SV, then that’s an adoption rate of…
Approximately 6.5% of Google users enrolled in 2SV.
To be honest, that’s a pretty high adoption rate in my opinion, and I think the ~40M estimate may be a bit high as well, knowing some comparables from other consumer 2FA offerings. On the other hand, Google has marketed 2SV well and is incentivized to drive users to adopt it to drive down their abuse/support costs.
There was some clever research published at EUROSEC ‘15 last month that leveraged an information leak in Google’s service to approximate 2SV adoption and their results came out to 6.4%, which is eerily close to our barely-counts-as-math estimate.
And, with a bunch of hand-waving, if you consider there to be between 5M-10M downloads of Google Authenticator on Android, probably ~10M on iOS, and a large chunk of non-app SMS 2SV users, then 40M could be a reasonable estimate. But I’d still say a more conservative estimate would be in the 20M-30M range.
Ta-da! Honorary math doctorate, please! Oh, thanks MIT, you shouldn’t have. Now to sit back and wait for someone from Google to tell me how far off I am. :-)